
Bringing your data to life with data-driven styling in Google Maps
Recently Google announced the release of the new data-driven styling feature to support building map applications with the Google Maps Javascript API. Here’s how this new feature can help you get the most out of your location data.
Data-driven styling in short
The data-driven styling capability in Google Maps enables users to present key information through Google Maps using private or publicly available data sources. Use Google’s administrative boundary data together with your own spatial or tabular data in order to create client-side visualizations such as customized chloropleths or highlight maps. All that is required is a Javascript vector map with a configured mapID, and the placeID’s or geographical names of the boundaries that will interact with your business data. As a premier Google Cloud partner, Localyse can help you set this up and get running quickly.
The existing Geocoding API can be used to acquire place IDs of interest. As an alternative the new Region Lookup API can also be used to find matching placeID’s related to your business data.
Data-driven styling is currently supported for Javascript. iOS and Android will be supported in a later stage. Google is still rolling out additional capabilities but let’s see what’s already possible with data-driven styling and potential use cases.
Use cases
While the use cases are very broad, here are a few potential use cases:
Highlighting the area of interest: When your users search for an address or location, such as nearby shops, building information or POIs, you can highlight the surrounding or containing administrative boundary, giving your search results more context and value.
Creating Chloropleth Maps: Combine tabular data with Google’s administrative boundaries to create chloropleth maps showing fluctuations in data across different geographic regions. Different administrative boundaries can be used to aggregate your data, such as postal code, city, state and countries polygons.
Apply dynamic map styling: Change the way your maps look based on dynamic data or user collected input. You can directly respond to user click events to update the map styles.
Demo with public data from the Netherlands
For this Localyse demo data from the CBS is used, summarizing the average value of houses sold per municipality in the Netherlands. First, let’s explore which administrative boundaries are available for the area of interest. For the Netherlands there are currently 3 options (we will use the administrative area level 2 boundaries, i.e. municipalities). New options are added by the Google team on a frequent basis.
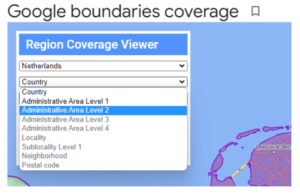
https://developers.google.com/maps/documentation/javascript/dds-boundaries/coverage
Next, a few things need to be prepared, alternatively you may be given these when you are a Localyse customer. This way you can forget about the hassle of setting up your own maps and styles.
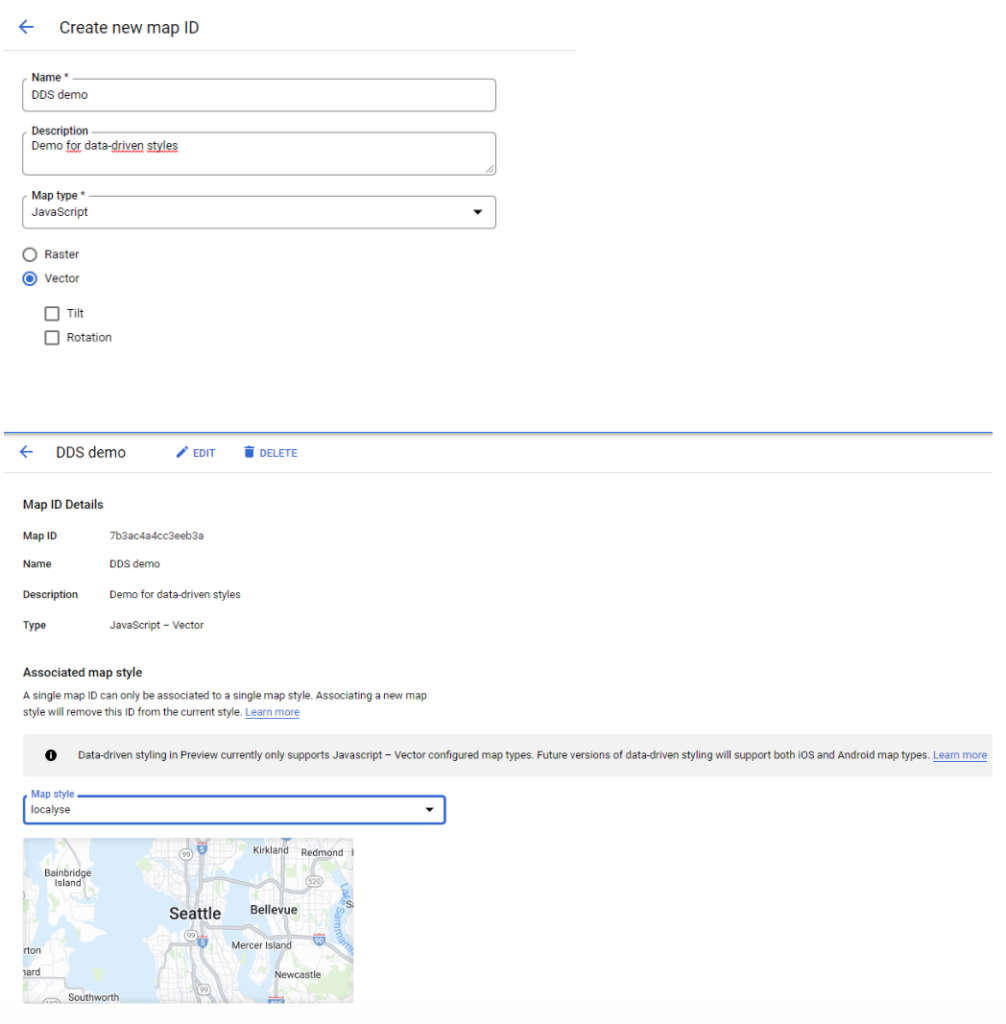
First a map style is required that will be added to the custom map.
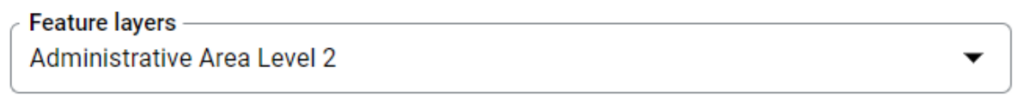
Under feature layers, the Administrative Area Level 2 option needs to be ticked in order to be able to use this option in the Javascript Maps API. Next create a new vector map, and associate the map style created in the previous step.
Adding the Public dataset to the code
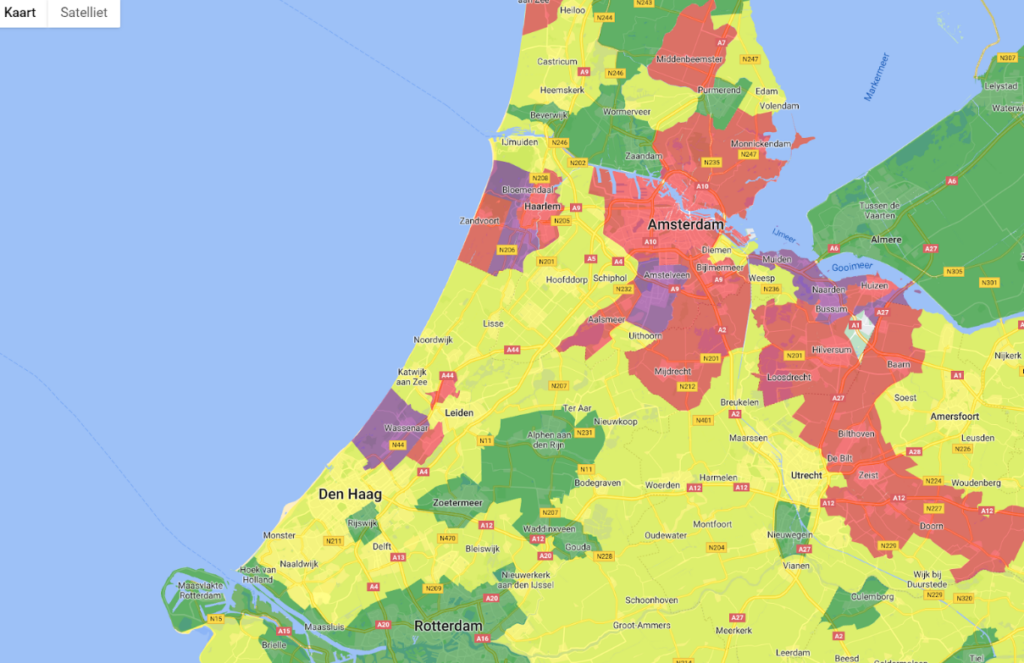
With data-driven styling the Administrative Area Level 2 feature layer from Google can be styled with data from the Dutch government. Several classes are defined to control the fill color of the polygons. This will be your legend. In this example municipalities with house prices beneath 300.000 euros are colored green, while the most expensive municipalities are colored purple (such as Amsterdam).
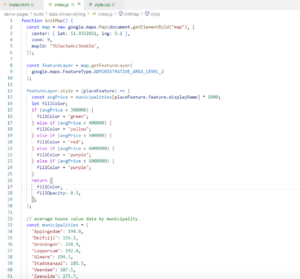
The resulting map shows a chloropleth showing the data fluctuations across the Netherlands.

Source: CBS 2022
Summary
Data-driven styling is a great way to enrich your existing data, tabular or spatial. The combination with existing Google Maps data opens up new possibilities to share key insights with your customers at no additional cost, all while speeding up the development process and keeping supporting infrastructure at a minimum.
Launch your own maps
At Localyse we are interested in what this new Google Maps capability brings for our customers. Talk to us about how you are using this feature, or get in touch to find out how to get started with your data today.


